- Published on
- Sun Jul 21, 2024
Part 11 - Tracing with OpenTelemetry and Jaeger
Introduction 
Tracing, a critical component, tracks requests through complex systems. This visibility reveals bottlenecks and errors, enabling faster resolutions. In our previous post of our go web services series , we explored observability’s significance. Today, we focus on tracing. Jaeger collects, stores, and visualizes traces from distributed systems. It provides crucial insights into request flows across services. By integrating Jaeger with OpenTelemetry, developers can unify their tracing approach, ensuring consistent and comprehensive visibility. This integration simplifies diagnosing performance issues and enhances system reliability. In this post, we’ll set up Jaeger, integrate it with OpenTelemetry in our application, and explore visualizing traces for deeper insights.
Motivation 
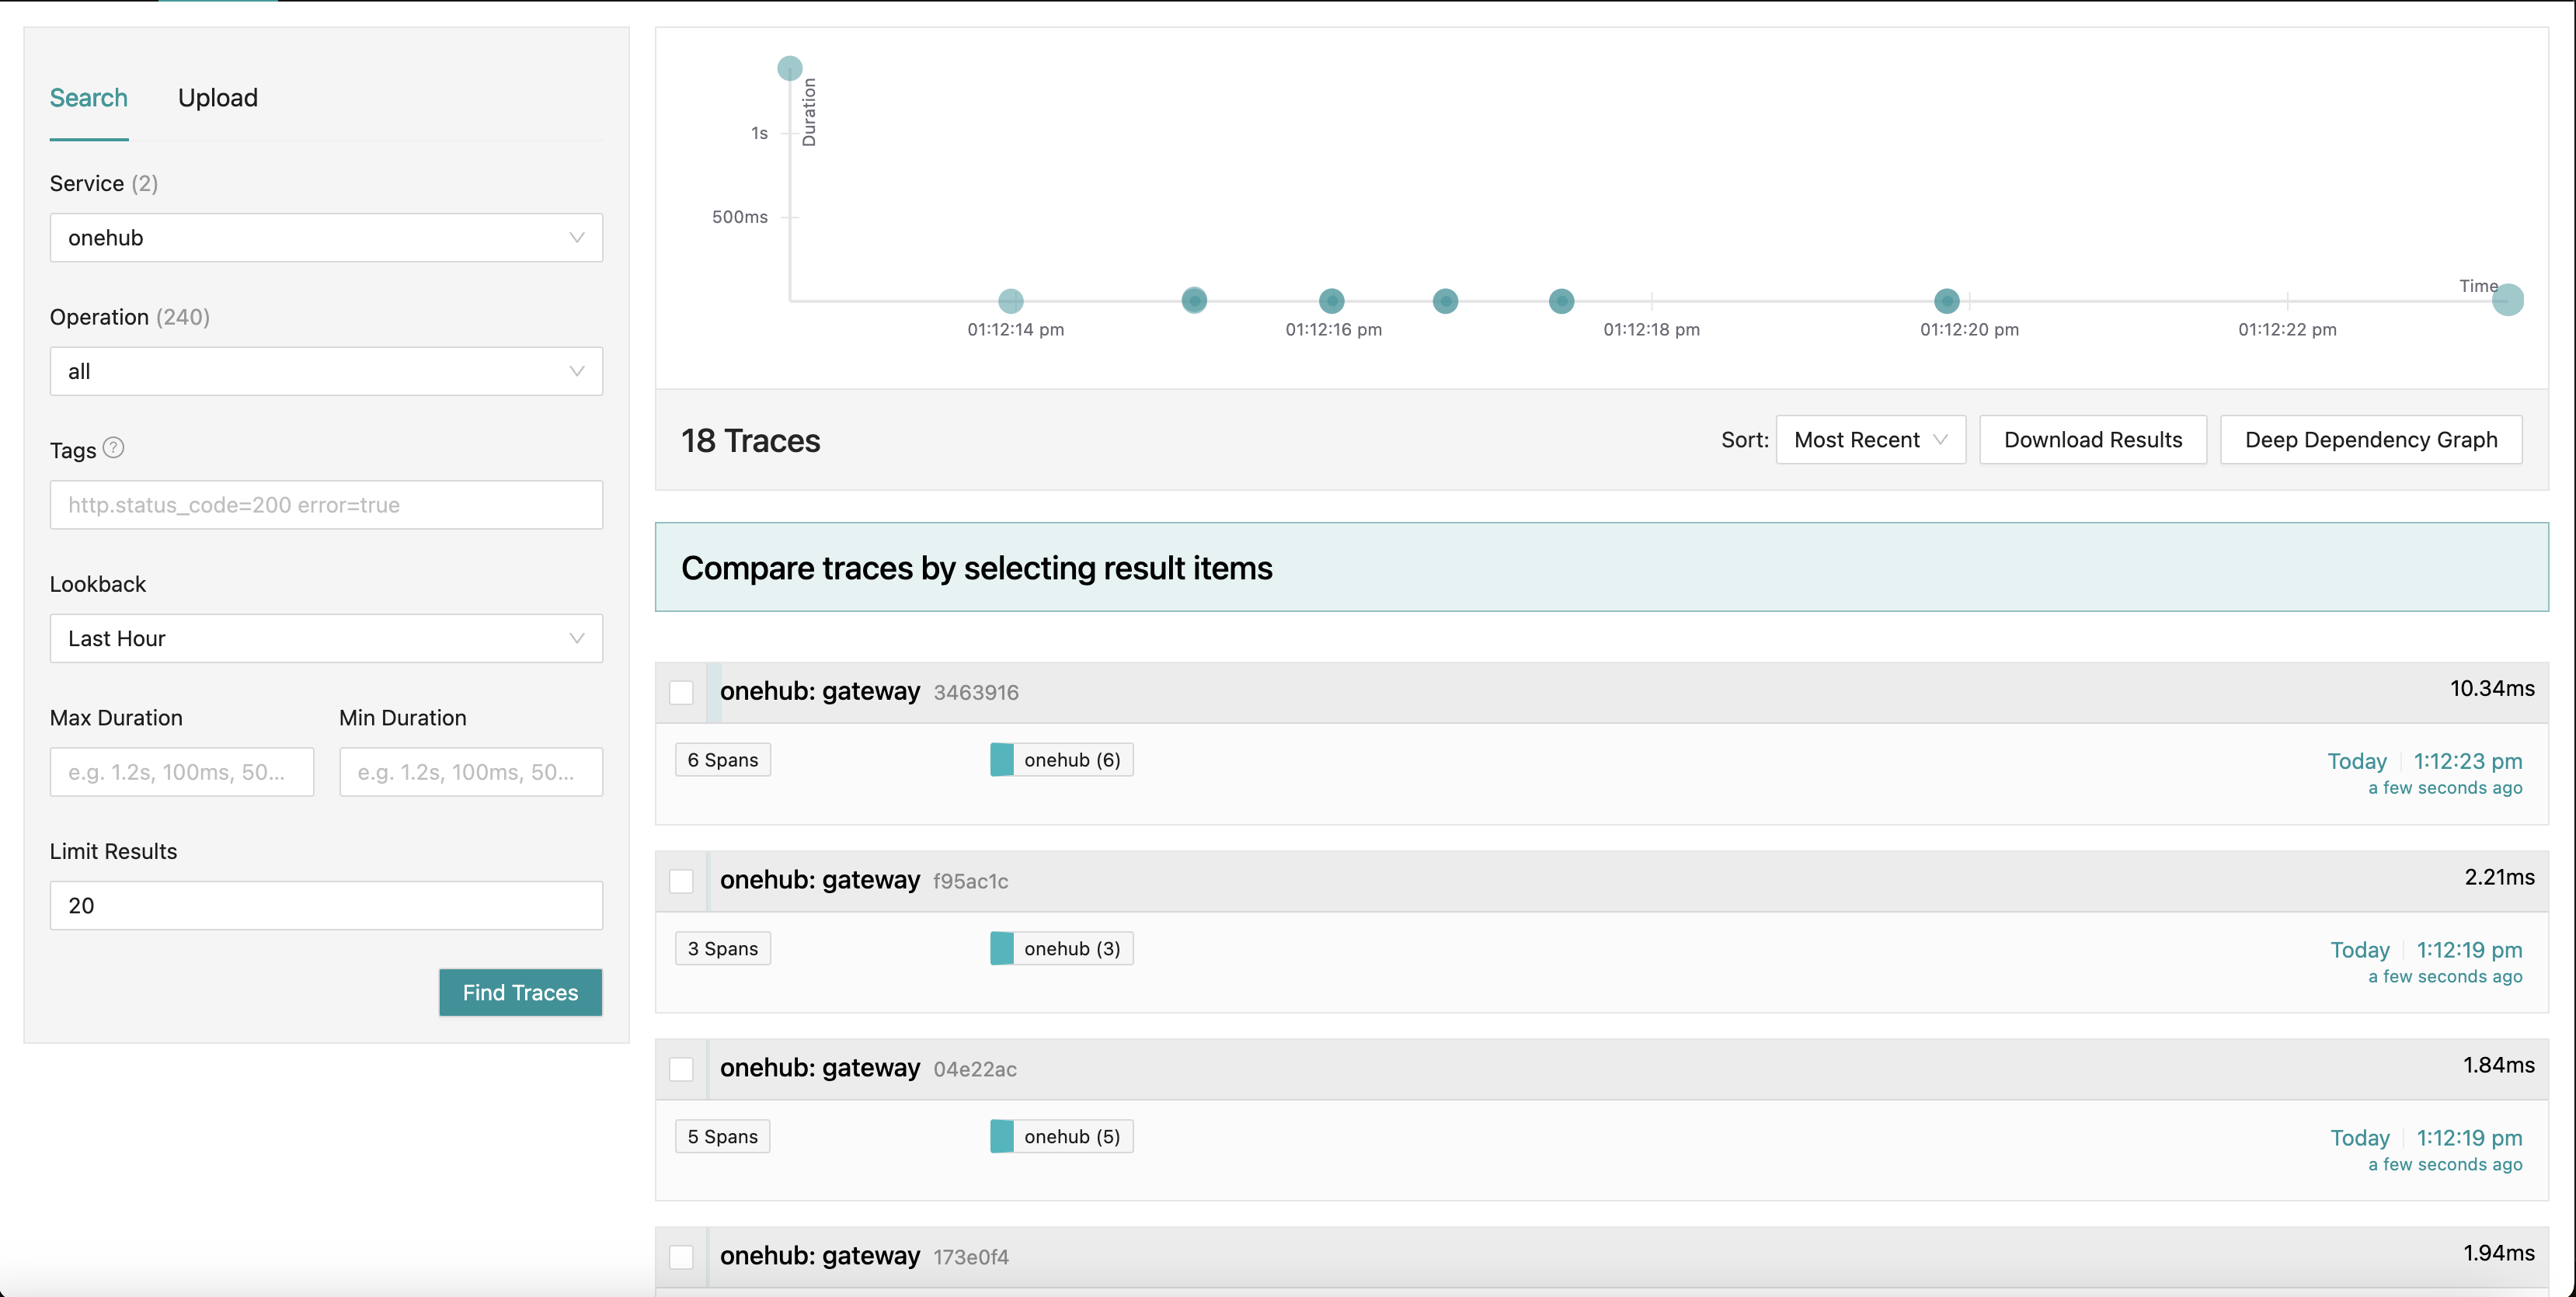
What we are working towards is a Jaeger dashboard that looks like:
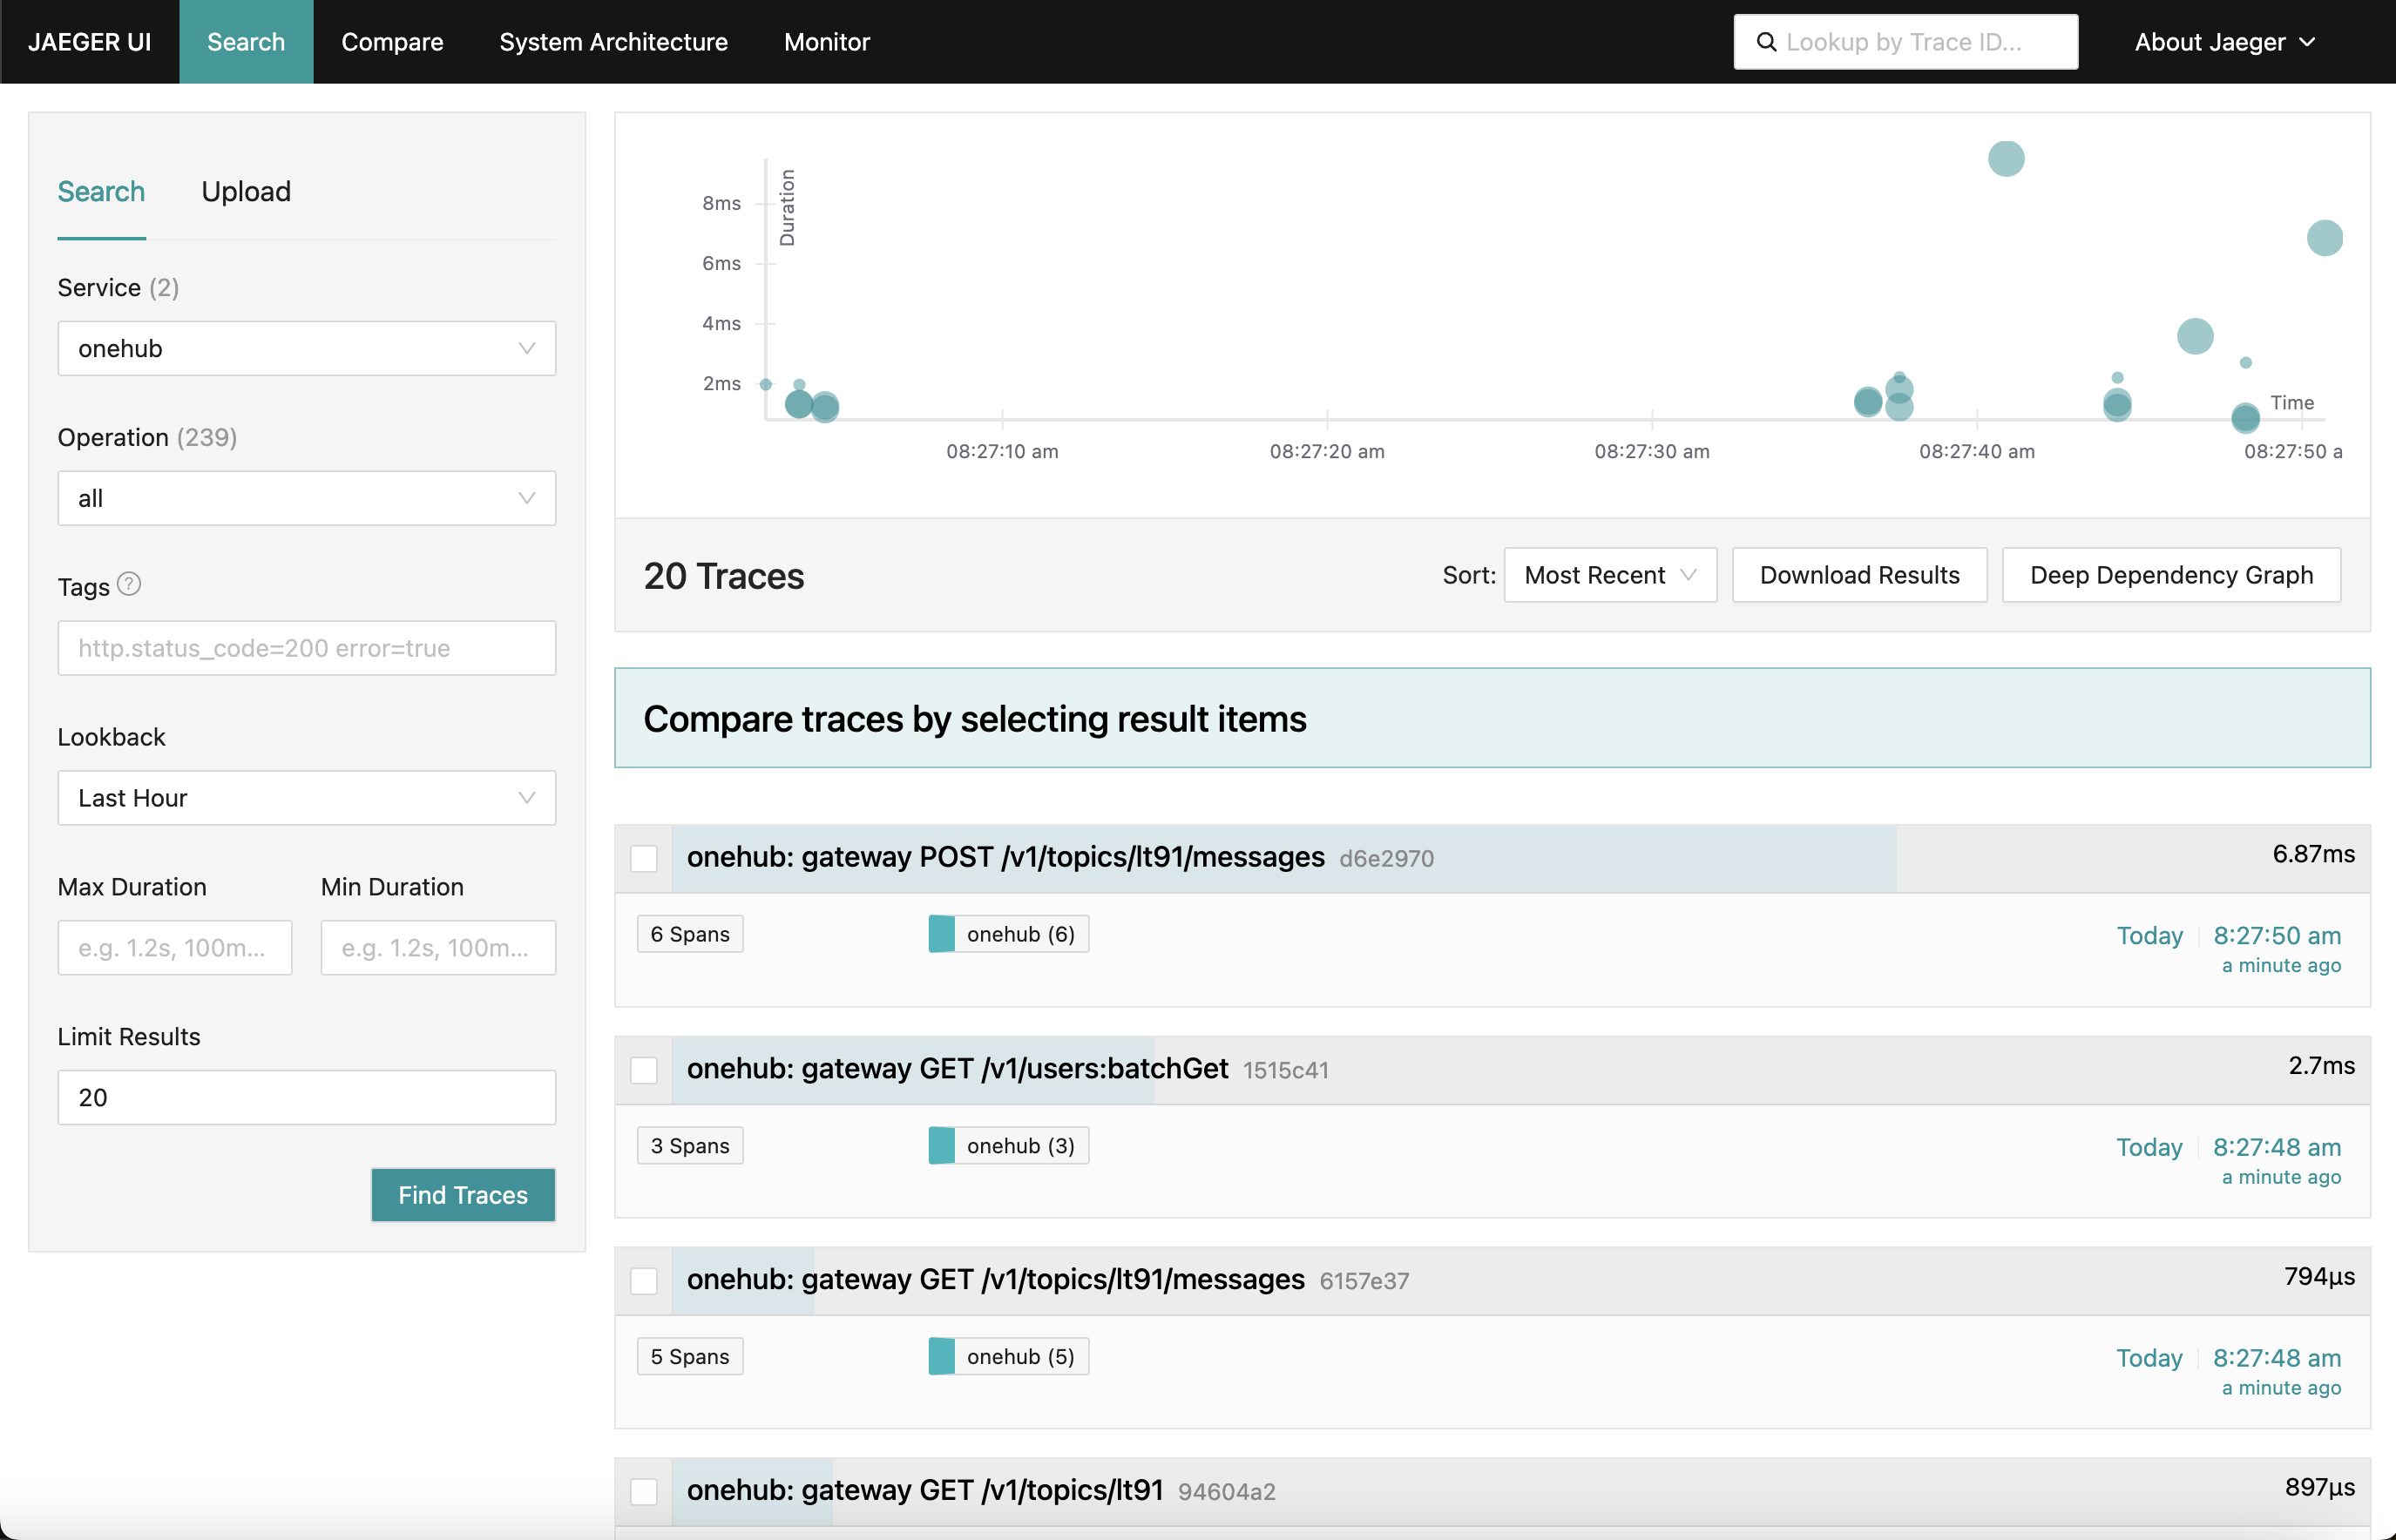
As we go to various parts of the app (on the Onehub frontend) the various requests’ traces are collected (from the point of hitting the grpc-gateway) with summary of each of them. We can even drill down into one of the traces for a finer detailed view. Look at the first POST request (for creating/sending a message in a topic):
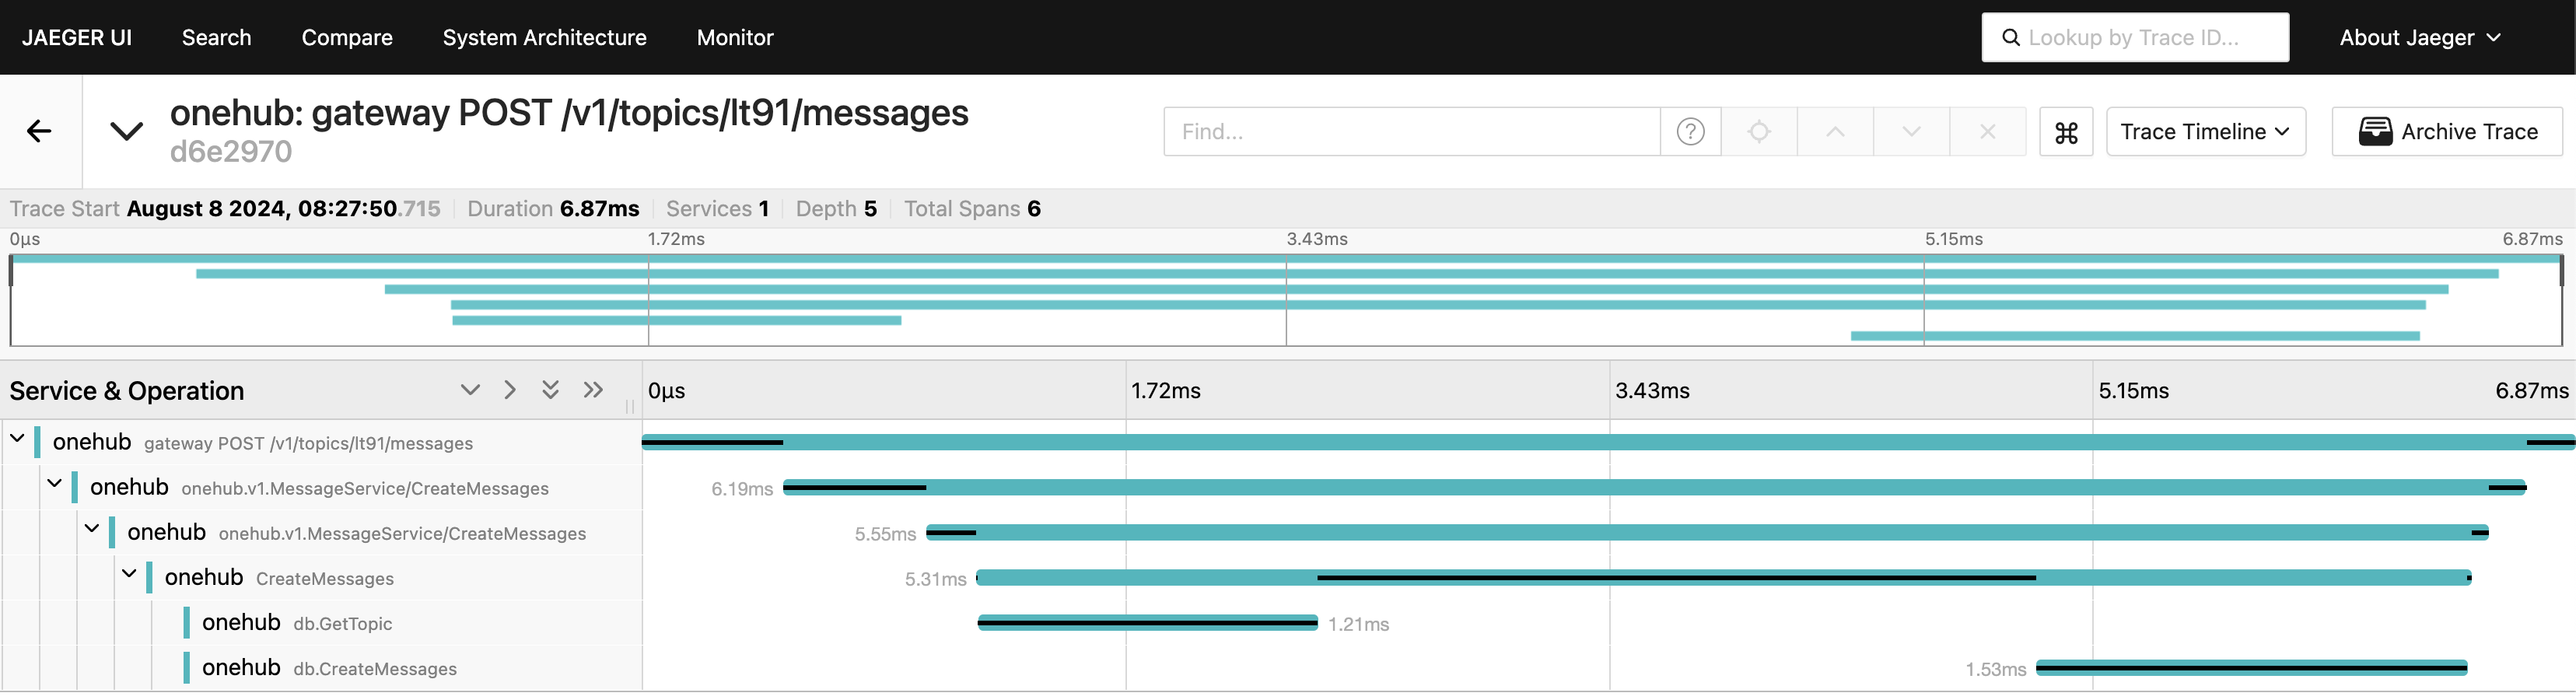
Here we see all the components the Create request touches along with their entry/exit times and time taken in and out of the methods. Very powerful indeed.
Getting Started 
TL;DR - To see this in action and validating the rest of the blog:
- Source for this is in PART11_TRACING branch
- Build all things needed (once you have checked out the branch):
make build
- We have broken the docker-compose into two parts (this will be explained further down) so make sure you have two windows running.
Terminal 1: make updb dblogs
Terminal 2: make up logs
- Navigate localhost:7080 and off you go.
Highlevel Overview 
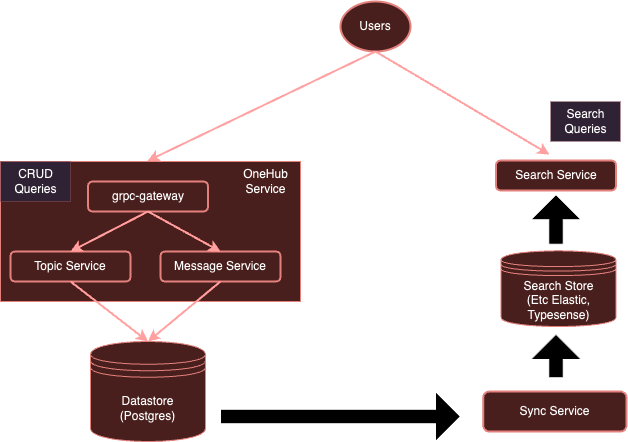
Our system is currently:
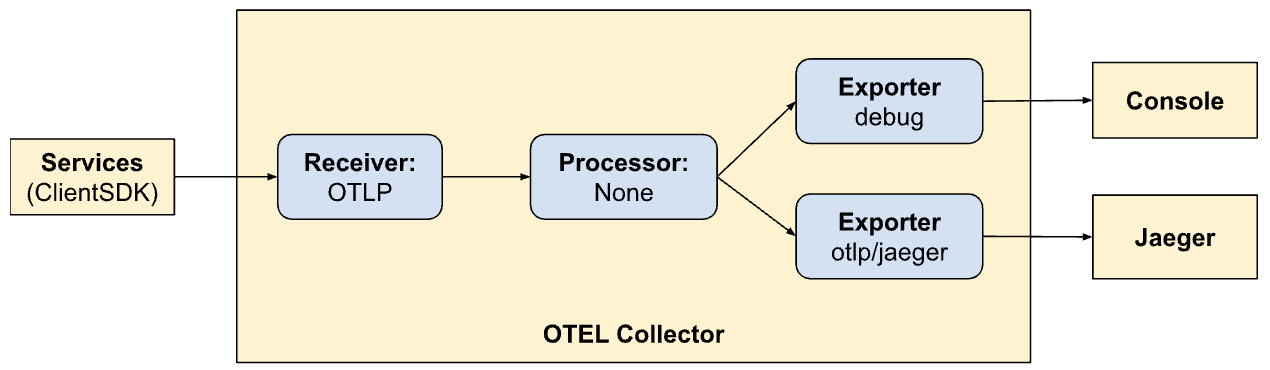
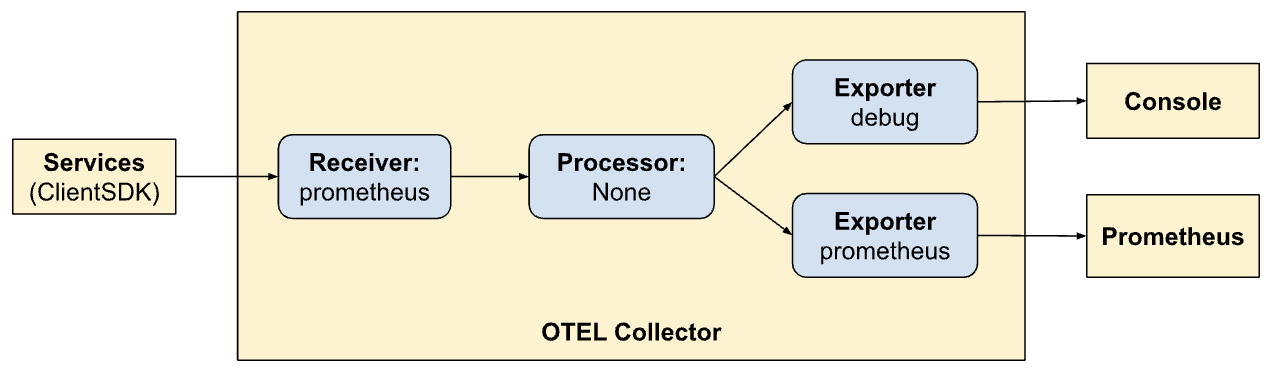
With instrumentation with OpenTelemtry our system will evolve to:

As we noted earlier, it is quite onerous for each service to use separate clients to send to specific vendors. Instead with an OTel collector running separately, we can ensure that all (interested) services can simply send metrics/logs/traces to this collector, which can then export to them various backends as required - in this case Jaeger for traces.
Let us get started.
Setup the OTel collector 
First step is to add our OTel collector running in the docker environment along with Jaeger so they are accessible.
Note: We have split our original all-encompassing docker-compose.yml config into two parts:
- db-docker-compose.yml: Contains all database and infra (non-application) related components liked databases (postgres, typesense) and monitoring services (OTel collector, Jaeger, Prometheus, etc).
- docker-compose.yml: Contains all application related services (nginx, grpc gateway, dbsync, frontend etc)
The two docker compose environments are connected by a shared network (onehubnetwork) through which services in these environments can communicate with each other. With this seperation we only need to restart a subset of services upon changes speeding our development.
Back to our setup, in our db-docker-compose.yml, add the following services:
services:
  ...

  otel-collector:
    networks:
      - onehubnetwork
    image: otel/opentelemetry-collector-contrib:0.105.0
    command: ["--config=/etc/otel-collector.yaml"]
    volumes:
      - ./configs/otel-collector.yaml:/etc/otel-collector.yaml
    environment:
      POSTGRES_DB: ${POSTGRES_DB}
      POSTGRES_USER: ${POSTGRES_USER}
      POSTGRES_PASSWORD: ${POSTGRES_PASSWORD}

  jaeger:
    networks:
      - onehubnetwork
    image: jaegertracing/all-in-one:1.59
    container_name: jaeger
    environment:
      QUERY_BASE_PATH: '/jaeger'
      COLLECTOR_OTLP_GRPC_HOST_PORT: '0.0.0.0:4317'
      COLLECTOR_OTLP_HTTP_HOST_PORT: '0.0.0.0:4318'
      COLLECTOR_OTLP_ENABLED: true

  prometheus:
    networks:
      - onehubnetwork
    image: prom/prometheus:v2.53.1
    command:
      - '--config.file=/etc/prometheus/prometheus.yml'
      - '--web.external-url=/prometheus/'
      - '--web.route-prefix=/prometheus/'
    volumes:
      - ./configs/prometheus.yaml:/etc/prometheus/prometheus.yml
    ports:
      - 9090:9090
Simple enough, this sets up two services in our docker environment:
- otel-collector: The sink of all signals (metrics/logs/traces) sent by the various services being monitored - (we will keep adding to this list over time). It uses the standard OTel image along with our custom otel config (below) which describes various observability pipelines (ie how signals should be received, processed and exported in various ways).
- jaeger: Our Jaeger instance that will receive and store traces (exported by the otel-collector). This hosts both the storage as well as the dashboard (UI) that we will export on the
/jaegerhttp path prefix to be accessible via nginx. - prometheus: Though not required for this post we will also export metrics so that it can be scraped by Prometheus. We will not discuss this in detail in this post.
A few things to note:
- Though not required for this post, we are passing the POSTGRES connection details (as environment variables) to the otel-collector so it can scrape postgres health metrics.
- Jaeger (after v1.35) supports OTLP natively.
- The beauty of OTLP is that OTel collectors can be chained forming a network of OTel collectors/processors/forwarders/routers etc.
- OTLP can be served either via a GRPC or a HTTP endpoint (on ports 4317 and 4318 respectively).
- By default the OTLP services are started on
localhost:4317/4318. This is fine if Jaeger is run on the same host/pod where the services (being monitored) are running. However since Jaeger is running on a seperate pod they have to be bound to external addresses (0.0.0.0). This was not clear in the documentation and resulted in significant hair-pulling. COLLECTOR_OTLP_ENABLED: trueis now the default and does not have to be specified explicitly.
OTel Configuration 
OTel also need to be configured with specific receivers, processors and exporters. We will do that in configs/otel-collector.yaml.
Adding receivers 
We need to tell the OTel collector which receivers are to be activated. This is specified in the receivers section:
receivers:
  otlp:
    protocols:
      http:
        endpoint: 0.0.0.0:4318
      grpc:
        endpoint: 0.0.0.0:4317
  postgresql:
    endpoint: postgres:5432
    transport: tcp
    username: ${POSTGRES_USER}
    password: ${POSTGRES_PASSWORD}
    databases:
      - ${POSTGRES_DB}
    collection_interval: 10s
    tls:
      insecure: true
This activates an OTLP receiver on port 4317 and 4318 (grpc, http respectively). There are many kinds of receivers that can be started. As ane xample we have also added a “postgresql” receiver that will actively scrape postgres for metrics (though that is not relevant for this post). Receivers can also be pull or push based. Pull based receivers periodically scrap specific targets (e.g. postgres) where as push based recievers listen to and ‘receive’ send metrics/logs/traces from applications using the OTel client sdk.
That’s it. Now our collector is ready to receive (or scrape) the appropriate metrics.
Add Processors 
Processors in OTel are a way to transform, map, batch, filter and/or enrich received signals before exporting them. For example processors can sample metrics, filter logs or even batch signals for efficiency. By default no processors are added (making the collector a pass-through). We will ignore this for now.
Add Exporters 
Now it is time to identify where we want the signals to be exported to - backends that are best suited for respective signals. Just like receivers, exporters can also be pull or push based. Push based exporters are used to emit signals to another receiver that acts in push mode. These are outbound. Pull-based exporters expose endpoints that can be scraped by other pull-based receivers (eg prometheus). We will add exporter of each kind - one for tracing and one for prometheus to scrape from (though prometheus is not the topic of this post):
exporters:
  otlp/jaeger:
    endpoint: jaeger:4317
    tls:
      insecure: true
  prometheus:
    endpoint: 0.0.0.0:9090
    namespace: onehub
  debug:
Here we have an exporter to jaeger running the OTLP collector - indicated by otlp/jaeger. This exporter will push traces regularly to Jaeger. We are also adding a “scraper” endpoint on port 9090 which prometheus will scrape regularly from.
The “debug” exporter simply is used for dumping signals to standard output/error streams.
Define pipelines 
The receiver, processor, exporter sections simply define the modules that will be enabled by the collector. They are still not invoked. To actually invoke/activate them, they must be referred in “pipelines”. Pipelines define how signals flow through and are processed by the collector. Our pipelines definitions (in the services section) will clarify this:
service:
  extensions: [health_check]
  pipelines:
    traces:
      receivers: [otlp]
      processors: []
      exporters: [otlp/jaeger, debug]

    metrics:
      receivers: [otlp]
      processors: []
      exporters: [prometheus, debug]
Here we are defining two pipelines. Note how similar the pipelines are but allow two different exporting modes (Jaeger and Prometheus). Now we are seeing the power OTel and in creating pipelines within it.
- traces
- Receive signals from client sdks
- No processing
- Export traces to console and Jaeger
- metrics
- Receive signals from client sdks
- No processing
- Export metrics to console and prometheus (by exposing an endpoint for it to scrape).
Exposing Dashboards via Nginx 
Jaeger provides a dashboard for visualizing trace data about all our requests. This can be visualized on a browser by enabling the following in our nginx config. Again though not the topic of this post - we are also exposing the Prometheus UI via nginx at the http path prefix /prometheus.
    ...
    location ~ ^/jaeger {
      if ($request_method = OPTIONS ) { return 200; }
      proxy_pass http://jaeger:16686;     # Note that JaegerUI starts on port 16686 by default
      proxy_pass_request_headers on;
      proxy_set_header Upgrade $http_upgrade;
      proxy_set_header Connection "upgrade";
      proxy_set_header Host $host;
      proxy_set_header Host-With-Port $http_host;
      proxy_set_header Connection '';
      proxy_set_header X-Real-IP $remote_addr;
      proxy_set_header X-Forwarded-For $proxy_add_x_forwarded_for;
      proxy_set_header X-Forwarded-HTTPS    on;
      proxy_set_header Authorization $http_authorization;
      proxy_pass_header Authorization;
      proxy_set_header X-Forwarded-Proto $scheme;
      proxy_set_header X-Forwarded-Host $host;
      proxy_set_header X-Forwarded-Prefix /;
      proxy_http_version 1.1;
      chunked_transfer_encoding off;
    }

    location ~ ^/prometheus {
      if ($request_method = OPTIONS ) { return 200; }
      proxy_pass http://prometheus:9090;
      proxy_pass_request_headers on;
      proxy_set_header Upgrade $http_upgrade;
      proxy_set_header Connection "upgrade";
      proxy_set_header Host $host;
      proxy_set_header Host-With-Port $http_host;
      proxy_set_header Connection '';
      proxy_set_header X-Real-IP $remote_addr;
      proxy_set_header X-Forwarded-For $proxy_add_x_forwarded_for;
      proxy_set_header X-Forwarded-HTTPS    on;
      proxy_set_header Authorization $http_authorization;
      proxy_pass_header Authorization;
      proxy_set_header X-Forwarded-Proto $scheme;
      proxy_set_header X-Forwarded-Host $host;
      proxy_set_header X-Forwarded-Prefix /;
      proxy_http_version 1.1;
      chunked_transfer_encoding off;
    }
    ...
Visualizing Traces in Jaeger 
Jaeger UI is quite comprehensive and has several features that you can explore. Navigate to the Jaeger UI in the browser. You will see a comprehensive interface for searching and analyzing traces. Go ahead and familiarize yourself with the main sections, including the search bar and the trace list. You can search for various traces by search criteria and filter by service, time durations, components etc.
Analyze the trace timelines in the different requests to understand the sequence of operations. Each span represents a unit of work, showing start and end times, duration, and related metadata. This detailed view is very helpful in identifying performance bottlenecks and errors within the trace.
Integrating the client SDK 
So far we have out setup our systems to visualize, consume signals etc. However our services are still not updated to emit the signals to OTel. Here we will integrate with the (Golang) client SDK in various parts of our code. The SDK documentation is a fantastic place to first familiarize with some of the concepts.
The key concepts we will deal with are described below.
Resources 
Resources are the entity which produces the signal. In our case the scope of the resource is the binary hosting the services. Currently we have a single resource for the entirety of the Onehub service but this could be split up later on.
This is defined in cmd/backend/obs.go. Note that the client SDK did not need us to go into the details of the resource definition explicitly. The standard helper (sdktrace.WithResource) lets us create a resource definition by inferring the most useful parts (like process name, pod name etc) at runtime.
We only had to override one thing - the OTEL_RESOURCE_ATTRIBUTES: service.name=onehub.backend,service.version=0.0.1 environment variable for the onehub service in docker-compose.yml.
Contexts Propogation 
Context propogation is a very important topic in observability. The various pillars are exponentially powerful when we can correlate signals from each of the pillars in identifying issues with our system. Think of contexts as extra bits of data that can be tied to the signals - ie can be “joined” in some unique way to relate the various signals to a particular group (say a reqeust).
Providers/Exporters 
For each of the signals, OTel provides a Provider interface (eg TracerProvider for exporting spans/traces, MeterProvider for exporting metrics, LoggerProvider for exporting logs and so on). For each of these interfaces there can be several implementations, eg Debug provider for sending to stdout/err streams, OTel provider for exporting to another OTel endpoint (in a chain), or even directly via a variety of exporters. However in our case we want to defer the choice of any vendors out of our services and instead send all signals to the OTel collector running in our environment.
To abstract this we will create an “OTELSetup” type that keeps track of the various providers we might want to use or swap out. In cmd/backend/obs.go we have:
type OTELSetup[C any] struct {
	ctx                 context.Context
	shutdownFuncs       []ShutdownFunc
	Resource            *resource.Resource
	Context             C

	SetupPropagator     func(o *OTELSetup[C])
	SetupTracerProvider func(o *OTELSetup[C]) (trace.TracerProvider, ShutdownFunc, error)
	SetupMeterProvider  func(o *OTELSetup[C]) (otelmetric.MeterProvider, ShutdownFunc, error)
	SetupLogger         func(o *OTELSetup[C]) (logr.Logger, ShutdownFunc, error)
	SetupLoggerProvider func(o *OTELSetup[C]) (*log.LoggerProvider, ShutdownFunc, error)
}
This is a simple wrapper keeping track of common aspects needed by the OTel SDK. Here we have providers (Logger, Tracer and Metric) as well as ways to provide context (for tracing). The over-arching Resource used by all providers is also specified here. Shutdown functions are interesting. They are functions called by the providers when the underlying exporter has terminated (gracefully or due to an exit). The wrapper itself takes a generic so specific instantiators of this Setup can use their own custom data.
The repo contains two implementations of this repo
- Logging signals to standard output/error - cmd/backend/stdout.go
- Exporting signals to another OTel collector - cmd/backend/otelcol.go
We will instantiate the second one in our app. We will not go into details of the specific implementations as they have been taken from the examples in the SDK with minor fixes and refactoring. Specifically take a look at the otel-collector example for inspiration.
Initialise the OTEL Providers 
The essence of enabling the collector in our services is that some kind of otel related “context” is started at all the “entry” points. If this context is created at the start then it will be sent to all targets called here, which is then propogated subsequently (as long as we do the right thing).
Taking the simple ListTopics api call (api/vi/topics) our reqeust takes the following path and back:
[ Browser ] ---> [ Nginx ] ---> [ gRPC Gateway ] ---> [ gRPC Service ] ---> [ Database ]
In our case the entry points here are at the start when the gRPC Gateway receives an API request from nginx (we could start tracing them from the point the http request hits Nginx to even highlight latencies at nginx but we will postpone for just a bit).
What is needed is:
- gRPC Gateway Receives a request
- It creates a “custom” otel specific
context.Contextinstance - Creates a custom connection to the respective grpc service (eg TopicService) passing this context instead of the default one.
- The respective service then uses this context when emitting the traces.
Let us go through this step by step.
Initialize and Prepare the OTel SDK for use 
In main.go, let us first initialise the collector connection:
func main() {
	flag.Parse()

	// Handle SIGINT (CTRL+C) gracefully.
	ctx, stop := signal.NotifyContext(context.Background(), os.Interrupt)
	defer stop()

	collectorAddr := cmdutils.GetEnvOrDefault("OTEL_COLLECTOR_ADDR", "otel-collector:4317")
	conn, err := grpc.NewClient(collectorAddr,
		// Note the use of insecure transport here. TLS is recommended in production.
		grpc.WithTransportCredentials(insecure.NewCredentials()),
	)
	if err != nil {
		log.Println("failed to create gRPC connection to collector: %w", err)
		return
	}
	setup := NewOTELSetupWithCollector(conn)
	err = setup.Setup(ctx)
	if err != nil {
		log.Println("error setting up otel: ", err)
	}

	defer func() {
		err = setup.Shutdown(context.Background())
	}()

	ohdb := OpenOHDB()

	srvErr := make(chan error, 2)

	httpSrvChan := make(chan bool)
	grpcSrvChan := make(chan bool)
	go startGRPCServer(*addr, ohdb, srvErr, httpSrvChan)
	go startGatewayServer(ctx, *gw_addr, *addr, srvErr, grpcSrvChan)

	// Wait for interruption.
	select {
	case err = <-srvErr:
		log.Println("Server error: ", err)
		// Error when starting HTTP server or GRPC server
		return
	case <-ctx.Done():
		// Wait for first CTRL+C.
		// Stop receiving signal notifications as soon as possible.
		stop()
	}

	// When Shutdown is called, ListenAndServe immediately returns ErrServerClosed.
	httpSrvChan <- true
	grpcSrvChan <- true
- Lines 8-16: we create a connection to the
otel-collectorrunning in our docker environment. - Lines 17-21: We then setup OTEL setup with tracer and metric providers so that our collector can now be pushed all traces and metrics (remember earlier we defined receivers in the otel config).
- Lines 23-25: Setup finalizers to cleanup otel connections/providers etc on shutdown
- Lines 27: Setup our DB and connections as before
- Lines 29 -: Previously we simply started GRPC and Gateway services in the background and that was it. We did not quite care about their return or exit statuses. For a more resilient system it is important to have a better insight into the lifecycle of the services we are starting. So now we pass “callback” channel for each of the services we are starting. When the servers exit the respective methods will call back on these channels available to them to indicate that they have exited gracefully. Our entire binary will exit when either one of these services exit.
As an example, let us see how our gateway service leverages this channel.
Instead of starting the http server (for the grpc-gateway) as:
http.ListenAndServe(gw_addr, mux)
We now have:
	server := &http.Server{
		Addr:        gw_addr,
		BaseContext: func(_ net.Listener) context.Context { return ctx },
		Handler: otelhttp.NewHandler(mux, "gateway", otelhttp.WithSpanNameFormatter(func(operation string, r *http.Request) string {
			return fmt.Sprintf("%s %s %s", operation, r.Method, r.URL.Path)
		})),
	}

	go func() {
		<-stopChan
		if err := server.Shutdown(context.Background()); err != nil {
			log.Fatalln(err)
		}
	}()
	srvErr <- server.ListenAndServe()
Pay attention to lines 9-14 where the server shutdown is watched for in a separate goroutine and line 15 where if there was an error when the server exited, it is sent back via the “notification” channel that was passed as an argument to this method.
Now the various parts of our services now have access to an “active” OTLP connection to use when ever signals are to be sent.
OTel Middleware for GRPC Gateway 
Above, the http.Server instance used to start the grpc Gateway is using a custom handler - the http.Handler in the Otel HTTP package. This Handler takes an existing http.Handler instance and decorates it with the OTel context and ensuring its propogation to any other downstreams that are called.
	server := &http.Server{
		Addr:        gw_addr,
		BaseContext: func(_ net.Listener) context.Context { return ctx },
		Handler: otelhttp.NewHandler(mux, "gateway", otelhttp.WithSpanNameFormatter(func(operation string, r *http.Request) string {
			return fmt.Sprintf("%s %s %s", operation, r.Method, r.URL.Path)
		})),
	}
Our HTTP handler is simple:
- Line 4: We create a new OTel specific wrapper to handle http requests
- Line 5: We set the Span formatter option so that the traces can be identified uniquely by the method and http request paths. Without this SpanNameFormatter, the default “name” for our traces at the gateway would simply be
"gateway"resulting in all traces looking like:
Wrapping Gateway to GRPC calls with OTel 
By default gRPC Gateway library creates a “plain” context when creating/managing connections to the underlying GRPC services. After all the gateway does not know anything about OTel. In this mode a connection (from the user/browser) to gRPC Gateway and the connection from the gateway to the gRPC service will be treated as two different traces.
So it is import to remove the responsibility of creating gRPC connections away from the Gateway - and instead provide a connection that is already OTel aware. We will do that now.
Prior to OTel integration, we were registering a Gateway handler for our gRPCs with:
	ctx := context.Background()
	mux := runtime.NewServeMux()    // Not showing the interceptors
	opts := []grpc.DialOption{grpc.WithInsecure()}

  // grpc_addr = ":9090"
	v1.RegisterTopicServiceHandlerFromEndpoint(ctx, mux, grpc_addr, opts)
	v1.RegisterMessageServiceHandlerFromEndpoint(ctx, mux, grpc_addr, opts)

  // And other servers
Now passing a different connection is simple:
	mux := // Creat the mux runtime as usual

	// Use the OpenTelemetry gRPC client interceptor for tracing
	trclient := grpc.WithStatsHandler(otelgrpc.NewClientHandler())

	conn, err := grpc.NewClient(grpc_addr,
		grpc.WithTransportCredentials(insecure.NewCredentials()),
		trclient)

	if err != nil {
		srvErr <- err
	}

	err = v1.RegisterTopicServiceHandler(ctx, mux, conn)
	if err != nil {
		srvErr <- err
	}

  // And the Message and User server too...
What we have done is first create a client (Line 6) that acts as a connection factory for our gRPC server. The client is pretty simple. Only that the grpc ClientHandler (otelgrpc.NewClientHandler) is being used to create the connection. This ensures that the context in the current trace that began on a new http request is now propogated to the gRPC server via this Handler.
That’s it. Now we should start seeing the new request to the Gateway and the Gateway->gRPC request in a single consolidated trace instead of as two different traces.
Begin and End Spans 
We are almost there. So far:
- We have enabled the OTel collector and Jaeger to receive and store trace (span) data (in docker-compose).
- We setup the basic OTel collector (running as a separate pod) as our “provider” of tracers, metrics and logs (ie our application’s OTel integration would use this endpoint to deposit all signals).
- We wrapped the Gateway’s http Handler to be OTel enabled so that traces and their contexts are created and propogated.
- We overrode the (gRPC) client in the gateway so that it now wraps the OTel context from our OTel setup instead of using a default context.
- We created global tracer/meter/logger instances so we can send actual signals using them.
Now we need to emit spans for all “interesting” places in our code. Take the ListTopics method for example (in services/topics.go):
func (s *TopicService) ListTopics(ctx context.Context, req *protos.ListTopicsRequest) (resp *protos.ListTopicsResponse, err error) {
	results, err := s.DB.ListTopics(ctx, "", 100)
	if err != nil {
		return nil, err
	}
	resp = &protos.ListTopicsResponse{Topics: gfn.Map(results, TopicToProto)}
	return
}
We call the database to fetch the topics and return it. Similar the database access method is (in datastore/topicds.go):
func (tdb *OneHubDB) ListTopics(ctx context.Context, pageKey string, pageSize int) (out []*Topic, err error) {
	query := tdb.storage.Model(&Topic{}).Order("name asc")
	if pageKey != "" {
		count := 0
		query = query.Offset(count)
	}
	if pageSize <= 0 || pageSize > tdb.MaxPageSize {
		pageSize = tdb.MaxPageSize
	}
	query = query.Limit(pageSize)
	err = query.Find(&out).Error
	return out, err
}
Here we would be mainly interested in how much time is spent in each of these methods. We simply create spans in each of these and we are done. Our additions to the service and datastore methods (respectively) are:
services/topics.go:
func (s *TopicService) ListTopics(ctx context.Context, req *protos.ListTopicsRequest) (resp *protos.ListTopicsResponse, err error) {
	ctx, span := Tracer.Start(ctx, "ListTopics")
	defer span.End()

  ... rest of the code to query the DB and return a proto response
}
datastore/topicds.go:
func (tdb *OneHubDB) ListTopics(ctx context.Context, pageKey string, pageSize int) (out []*Topic, err error) {
	_, span := Tracer.Start(ctx, "db.ListTopics")
	defer span.End()

  ... rest of the code to fetch rows from the DB and return them
}
The general pattern is:
1. Create a span:
ctx, span := Tracer.Start(ctx, "<span name>")
Here the given context (ctx) is “wrapped” and a new context is returned. We can (and should) pass this new wrapped context to futher methods that . We do just that when we call the datastore ListTopics method.
2. End the span:
defer span.End()
Ending a span (wheneever the method returns) ensures that the right finish times/codes etc are recorded. We can also do other things like add tags and statuses to this if necessary to cary more information to aid with debugging.
That’s it. You can see your beautiful traces in Jaeger and get more and more insights into the performance of your requests end to end!
Conclusion 
We covered a lot in this post and still barely scratched all the details behind OTel and tracing. Instead of overloading this (already loaded) post we will introduce newer concepts and intricate details in future posts. For now give this a go in your own services and try playing with other exporters and receivers in the otel contrib repo.